2019

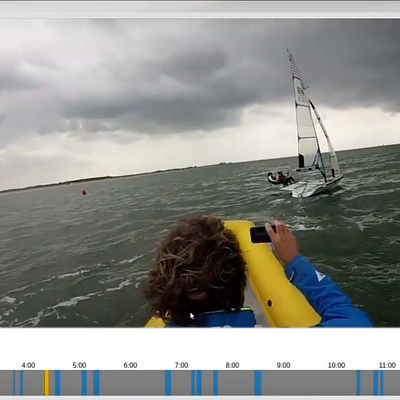
The setup used to play Loud and Clear
Berend Baas, Dennis van Peer, Jan Gerling, Matthias Tavasszy, Nathan Buskulic, et al.
In Proceedings of GALA, 2019
OMiCroN overview. A renderable hierarchy is maintained while inserting incoming nodes in parallel. This cycle is repeated until the whole hierarchy is constructed.
Vinicius da Silva, Claudio Esperança, and Ricardo Marroquim
Computers & Graphics, 2019
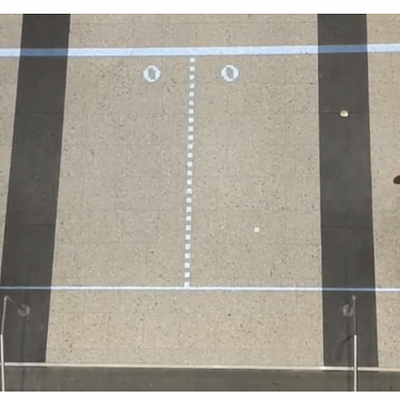
A portal through which a laser can be teleported.
Bob Dorland, Lennard van Hal, Stanley Lageweg, Jurgen Mulder, Rinke Schreuder, et al.
In Proceedings of GALA, 2019
 Facet orchestration in Angelina, where different online sources are used to combine visuals and audio based on the mood and keywords of a Guardian article acting as (external) narrative. The level generator however was not connected to the remaining facets. The in-game screenshot is from [56].
Antonios Liapis, Georgios N Yannakakis, Mark J Nelson, Mike Preuss, and Rafael Bidarra
IEEE Trans Games, 2019
Left: single frame from 240Hz short-exposure video and a simulated long exposure at 30Hz by averaging 8 frames. Middle: Using the 240Hz input, our method enables mixing a long exposure in the periphery with a short exposure for the details on the pendulum. Via user annotations in the video, different shutter functions can be defined (top right). Annotations and shutter functions can be keyframed over time. Based on the annotations, our method defines an interpolated shutter function for each pixel (bottom right).
Nestor Z. Salamon, Markus Billeter, and Elmar Eisemann
Computer Graphics Forum, 2019
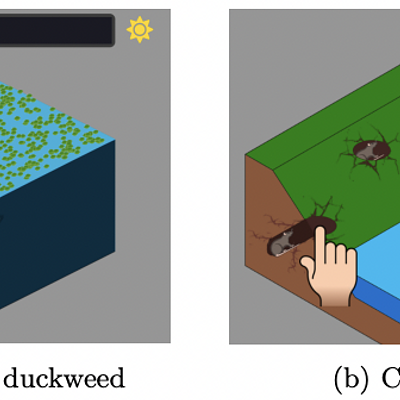
The valuables (magenta) have to be dragged to the dropzone (green circle). If the junk (brown) ends up in the dropzone the score decreases. The space snot (large green blob) is an obstacle in which ships and valuables can get stuck.
Shaad Alaka, Max Lopes Cunha, Jop Vermeer, Nestor Z. Salamon, J. Timothy Balint, and Rafael Bidarra
Int J Serious Games, 2019
Two armadillos (274k tetrahedra) in a pool of water (633k particles) simulated at 60 FPS with a time step of 1/60s. Fluid-deformable interaction and (self-)collisions are handled. The user can interact with the scene through click-and-dragging the meshes.
Christopher Brandt, Leonardo Scandolo, Elmar Eisemann, and Klaus Hildebrandt
ACM Transactions on Graphics, 2019
Saskia J Santegoets, Vanessa J van Ham, Ilina Ehsan, Pornpimol Charoentong, Chantal L Duurland, et al.
Clin Cancer Res, 2019
Quantification and cytotoxic capacity of the TAI cells in the TME
Guillaume Beyrend, Esmé T.I. van der Gracht , Ayse Yilmaz, Suzanne van Duikeren, Marcel Camps, et al.
J Immunother Cancer, 2019
Left: In the first detector setup the sample is illuminated by collimated light. The scattered light is captured and coupled into a fiber cable by an achromatic lens. The fiber cable is connected to an Ocean Optics Spectrometer. — Right: In the second detector setup the achromatic lens is replaced by an integrating sphere from Thorlabs and the sample is illuminated by converged light.
Olaf Clausen, Ricardo Marroquim, Arnulph Furhmann, and Holger Weigand
In Proceedings of MAM@EGSR, 2019
LDA accuracy and rejection size per sample. (A) boxplot of the LDA accuracy distribution per sample, while using a rejection threshold (0 = no rejection). (B) Boxplot of the rejection percentage per sample while using a rejection threshold (0 means no rejection). Each dot represents a sample colored according to the sample type (CeD: celiac disease; Ctrl: control; RCDII: refractory celiac disease type II; CD: Crohn’s disease).
Tamim Abdelaal, Vincent van Unen, Thomas Höllt, Frits Koning, Marcel Reinders, and Ahmed Mahfouz
Cytometry A, 2019
Three kinetic modules of pseudotime-dependent genes (n= 1,376) depicted in a log-variance-stabilized expression heat map, indicating gene-enriched biological processes. Genes confirmed by mass cytometry and flow cytometry are denoted by black labels, and genes involved in TCR signaling are denoted by gray labels. The dashed gray box indicates the coordinated expression profile of TNF, FASL and FYN. Euclidean distance values comparing gene expression profiles for each ordered pair of neighboring cells along the pseudotime trajectory are shown in the graph (right).
Na Li, Vincent van Unen, Tamim Abdelaal, Nannan Guo, Sofya Kasatskaya, et al.
Nat Immunol, 2019
Leonardo Scandolo, Pablo Bauszat, and Elmar Eisemann
Computer Graphics Forum, 2019
Gerard Simons, Sebastian Herholz, Victor Petitjean, Tobias Rapp, Marco Ament, et al.
Computer Graphics Forum, 2019
 Single molecule (sm)FISH analysis of gene expression levels in human MTG layers 2 and 3
Rebecca Hodge, Trygve E. Bakken, Jeremy Miller, Kimberly Smith, Eliza Barkan, et al.
Nature, 2019
Left: Our novel segmentation tool performing a porosity analysis on an aluminum cast part with multiple linked views: 2D slices, Direct Volume Rendering, and interactive parallel coordinates. Right: CT data set rendered at real-time frame rates using Direct Volume Rendering.
Harald Steinlechner, Georg Haaser, Bernd Oberdorfer, Daniel Habe, Stefan Maierhofer, et al.
In Proceedings of International Conference on Industrial Computed Tomography (ICT) 2019, 2019
Cehao Yu, Elmar Eisemann, and Sylvia Pont
Perception, 2019
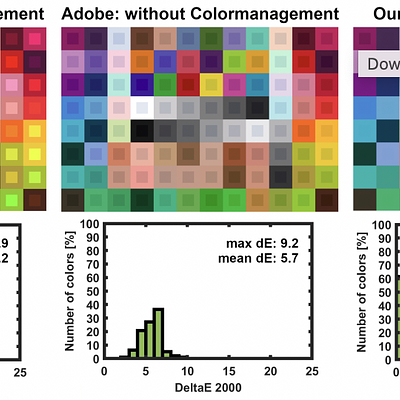
Comparison of measured colors with its reproduction with the sRGB, the AdobeRGB, and the measured display profile on the Vive Pro
Olaf Clausen, Gregor Fischer, Arnulph Furhmann, and Ricardo Marroquim
In Proceedings of 16th GI AR/VR Workshop, 2019
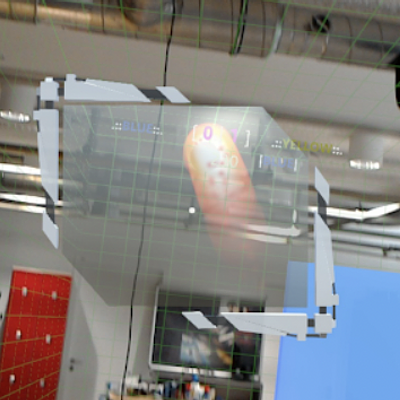
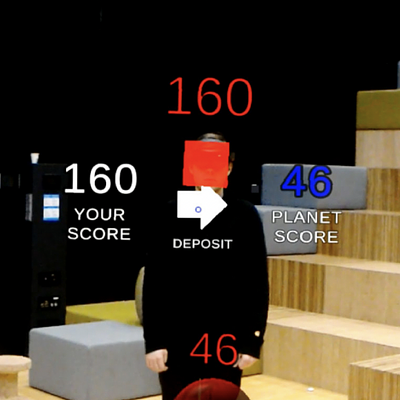
A League of Lasers player’s view, through the HoloLens.
Nico Arjen Miedema, Jop Vermeer, Stephan G. Lukosch, and Rafael Bidarra
In Proceedings of IEEE VR - Workshop on Superhuman Sports, 2019